Engineering · 2026.10.01 · 7 min · Updated 2026.10.26
Speeding Up Rust and Next.js CI on GitHub Actions: From 11.5 Minutes to 1.5 on a 2 vCPU Runner
After moving the backend to Rust, the PR backend job went from 11.5 minutes to 1.5 and frontend checks from 81 seconds to 30, mostly through test databases, bcrypt, and caches that broke silently.
Reading

In the first PR for my Rust backend, the backend job on GitHub Actions ran for 11 and a half minutes, then failed because the disk filled up.
I later got it down to 1 min 33 s, and frontend checks from 81 seconds to 30. Most of the time came out of three places: how tests hit Postgres, bcrypt in tests, and a few bugs that silently broke caching.
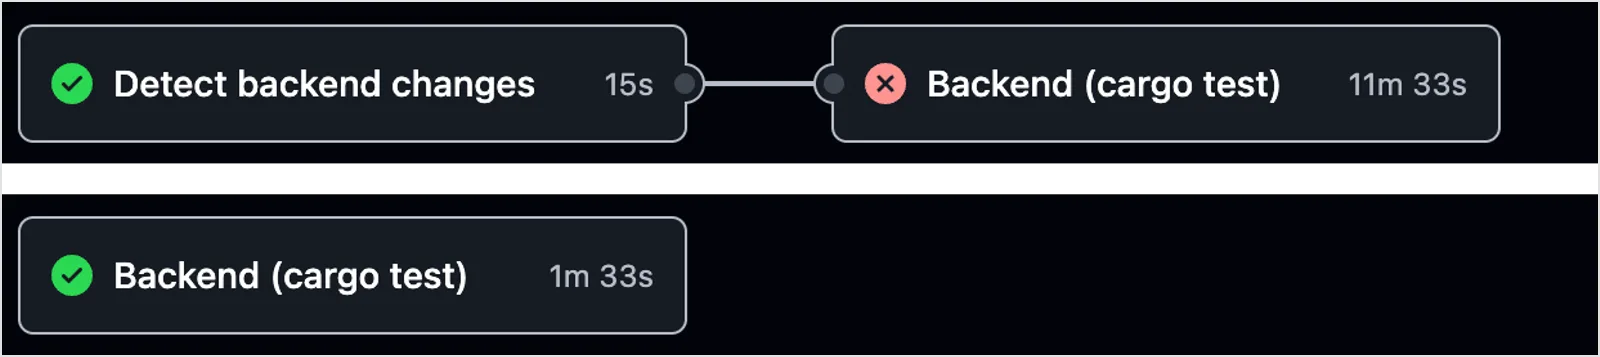 Top: the first run, 11m 33s and failed. Bottom: arm64 with a warm cache, 1m 33s.
That was the first PR after migrating the backend from Java Spring Boot to Rust. The constraints were a private repo, a 2,000-minute monthly Actions quota, a single backend crate, and GitHub's standard runners.
Measure the 2 vCPU runner first
Standard runners for private repos have 2 vCPUs. Compared with an M-series Mac, compilation is about 2.2 times slower and Postgres-heavy work about 4 times slower.
Anything that runs fast locally gets multiplied several times over in CI.
Of those first 11 and a half minutes, downloading crates took 3 seconds. The bulk was cold compilation with no cache, plus DROP DATABASE.
I would never have guessed that without measuring.
Postgres and bcrypt
Rust repositories have no DI (dependency injection, the thing that lets tests swap in a fake database), so nearly every test hits a real Postgres.
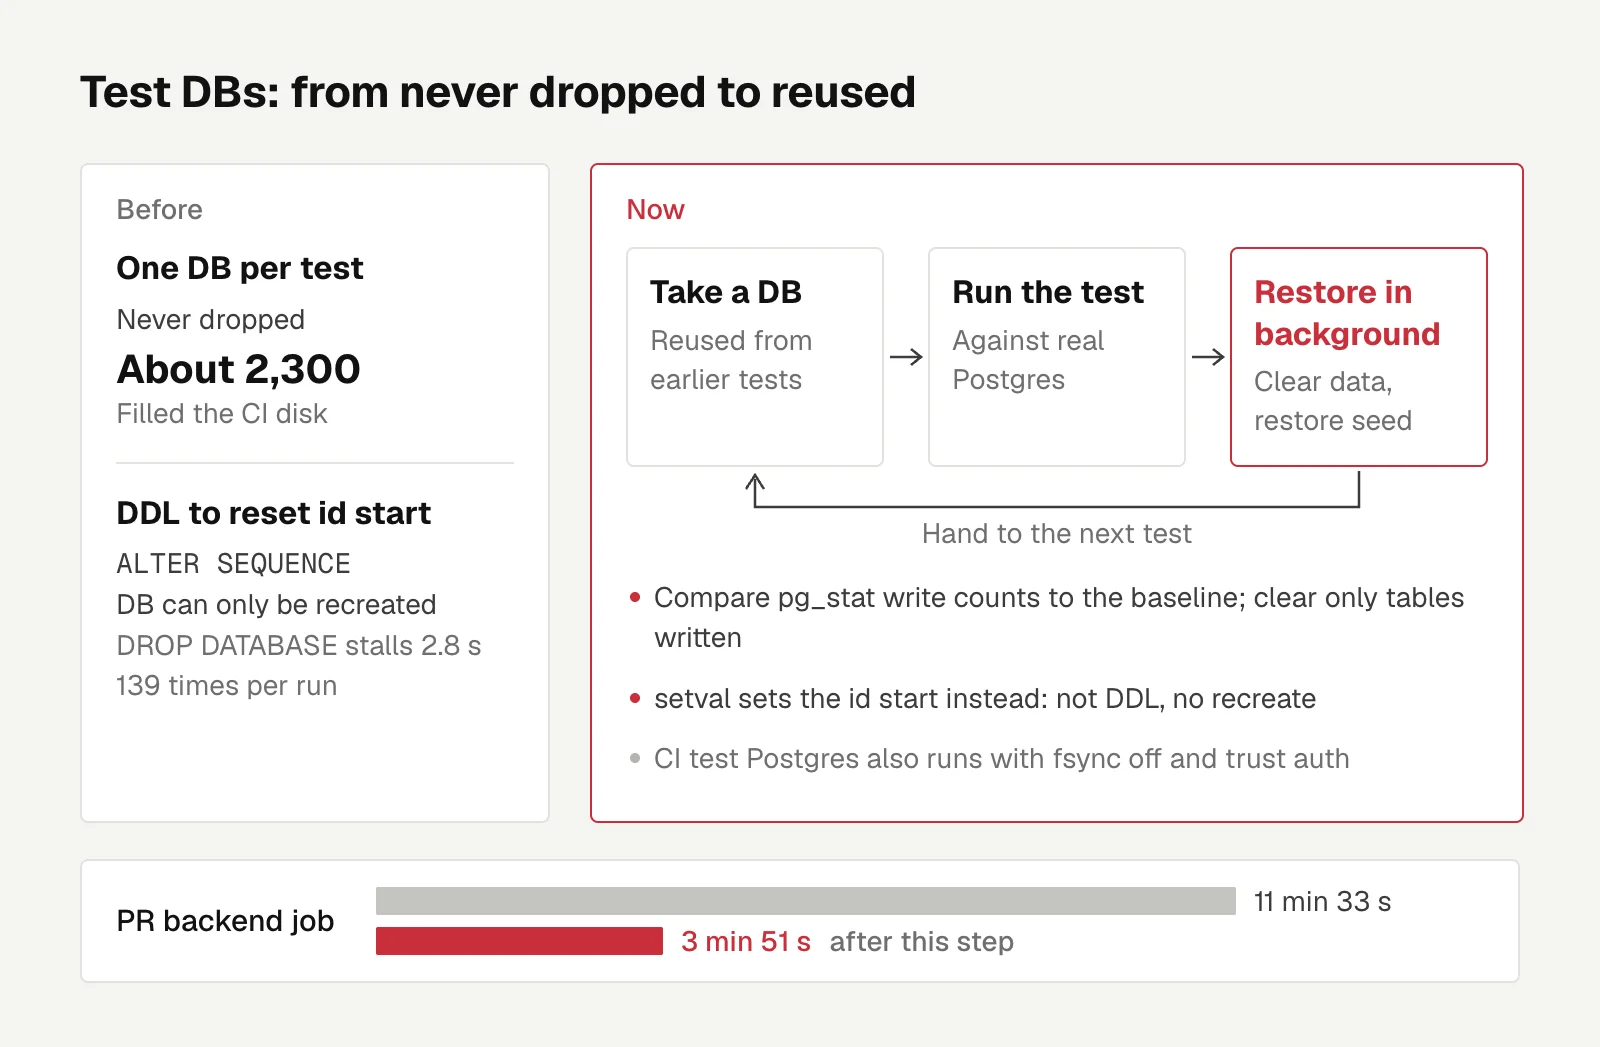
Each test used to create its own test DB and never drop it. On CI they piled up to about 2,300 and filled the disk. I changed it to reuse them: when a test finishes, a background task clears the data, restores the seed data, and hands the DB to the next test.
The restore doesn't need to clear every table. Postgres keeps cumulative insert, update, and delete counts per table in pg_stat, so comparing them with the baseline from the last restore tells you which tables the previous test wrote to.
There were also two helpers that used ALTER SEQUENCE ... RESTART to change where ids start. That's DDL, so the DB could only be dropped and recreated, and each DROP DATABASE stalled for 2.8 seconds, 139 times per run. Switching to setval has the same effect and isn't DDL.
On top of that, the CI test Postgres runs with fsync off and trust authentication. After this step, 11 min 33 s came down to 3 min 51 s.
Next was CPU, and more than 60% of the test process's time went to bcrypt.
Registration and login tests go through the real flow and compute cost 12 every time. Tests now use cost 5, with a separate test guarding that production is still 12.
Each test DB also keeps persistent connections now, and the average number of connections opened per test fell from about 3.3 to 1.4.
GitHub Actions cache traps
At this point the median PR job with a warm cache was about 2.6 minutes. But 6 out of 25 runs were cold and took 7.5 to 12 minutes.
I compared against well-known Rust projects that also test against Postgres, and my config was already near the front of the pack. What made it slow was a few bugs.
The first was a half-built cache squatting on the key. rust-cache's cache-on-failure let a cancelled run save a 72MB, nearly empty cache. And GitHub caches can't be updated once saved:
You cannot change the contents of an existing cache. Instead, you can create a new cache with a new key.
That's from GitHub's dependency caching docs. So every run after that hit the empty cache exactly and never saved a new one. Every build was effectively cold, and it was never going to fix itself.
The second was cold compiles happening too often. The toolchain wasn't pinned, so on the day stable shipped a new release, every run compiled cold. The content hash of the vendored sqlx-postgres was part of the cache key, so any change to the vendored code rebuilt all 300-plus dependencies. The version is now pinned in rust-toolchain.toml, and the vendored crate uses option_env! so cargo only rebuilds that one crate.
The third: rule changes don't send you a notice. Since cargo 1.99, the presence of a CI environment variable turns incremental compilation off by default, so the speedup would have broken silently on upgrade day. Compilation now goes through a wrapper that removes CI.
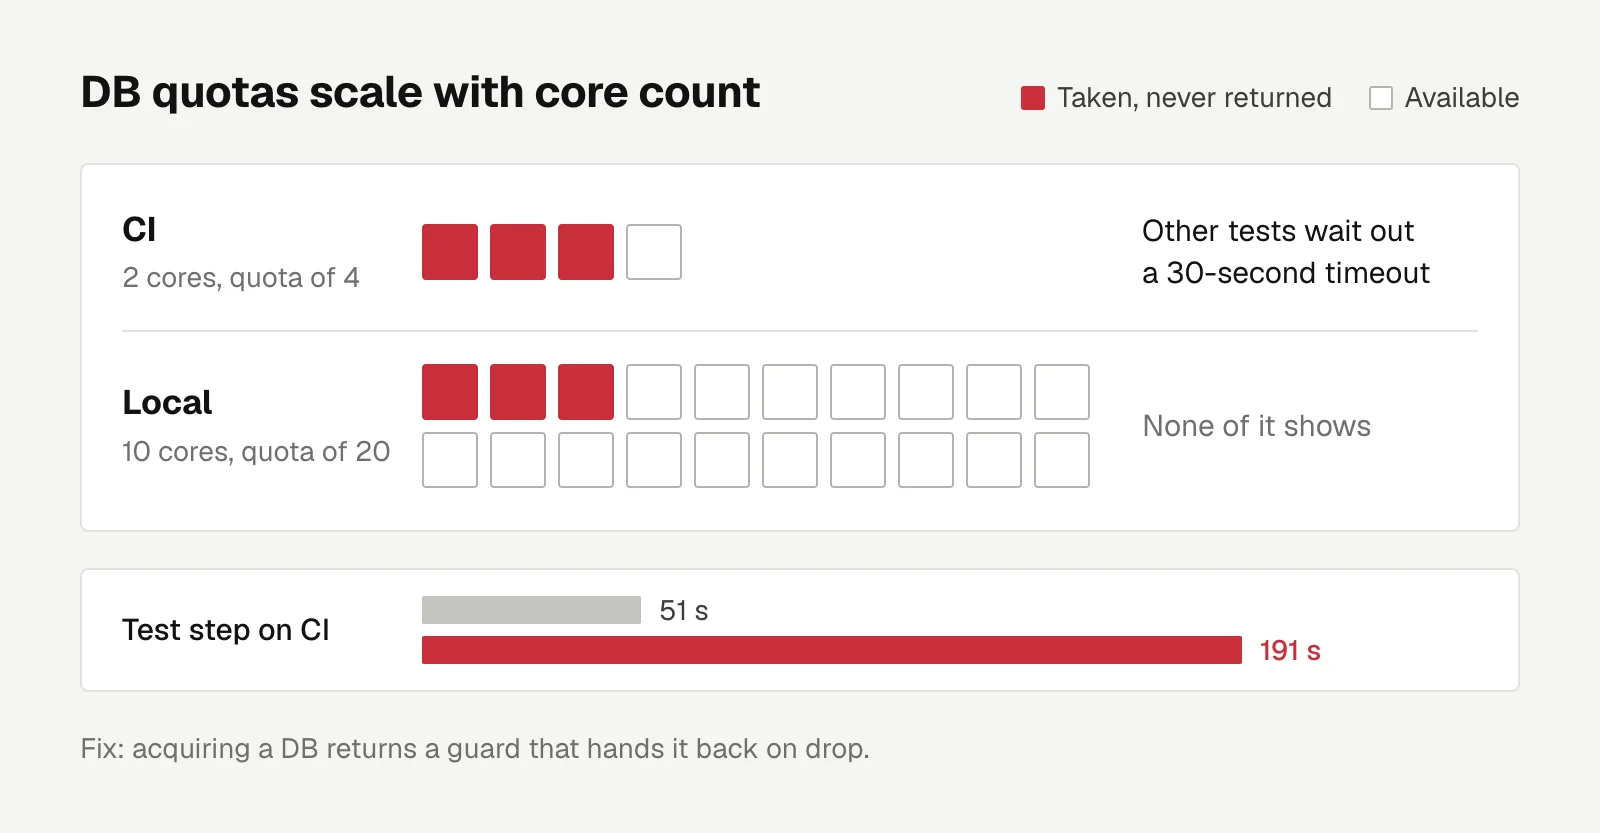
The fourth: resource quotas scale with core count. A new test took a DB and never gave it back. The DB quota is twice the number of parallel tests, which on 2-core CI means 4. With 3 of them held, other tests had to wait out a 30-second timeout, and the test step went from 51 seconds to 191.
Locally, with 10 cores and a quota of 20, none of this showed.
Acquiring a DB now returns a guard that hands it back automatically on drop.
The incremental cache key also changed from the commit SHA to content (the toolchain version plus the git tree of backend/), so nothing is re-saved when the backend hasn't changed. Total cache size fell from 11.4GB to about 2GB.
Frontend checks: 81 seconds to 30
Frontend time was mostly next build at 28 seconds and ESLint at 18, and two things only came out after digging.
Over 80% of ESLint's time was the React Compiler rule set, and when Next 16 removed next lint, the cache that came built in went away with it. The type check inside next build can't use incremental mode either, so it starts from scratch every time.
The fixes: ESLint runs with --cache in the background, in parallel with the build, and Turbopack's build file cache is on. Type checking is its own step using the native TypeScript 7, and a full cold run takes 2 to 3 seconds. On a cache hit, node_modules is restored directly instead of running npm ci.
Turbopack's file cache is still experimental, so only PRs read it. Main always builds cold, and artifacts headed for STG never depend on the cache.
Before and after, and what I skipped
| Item | Before | After |
|---|---|---|
| PR backend job | 11 min 33 s | 1 min 33 s (warm cache, arm64) |
| Tests within that job | 196 s | 33 to 36 s |
| Merge to STG | about 7.5 min | about 4 min 10 s |
| Total Actions cache | 11.4GB | about 2GB |
| PR frontend checks | 81 s | about 30 s |
The last step was switching to arm64 runners. Their 2 vCPUs are 2 physical cores, while x64 gives you 1 core with SMT. DB tests that saturate both cores went from 42.7 seconds to 33.3, and the per-minute price is lower too.
Splitting into multiple crates was the direction I originally wanted to go. Simulating with 250 commits from the Java era, cutting straight along module lines only reduced average compilation to 0.96x, and another way of cutting made it 1.20x. The modules that change most often are also the ones the most other modules depend on.
I also evaluated a self-hosted runner, but the idle 4-core ARM machine I have was slower at incremental builds, and I'd have to maintain it myself.
The usual speedups like nextest, mold, and splitting crates mostly don't help here; they rely on many cores and many test binaries, which a single crate on 2 vCPUs doesn't have. What actually worked was measuring where the CPU time goes first, and keying caches on content instead of the commit SHA.

Engineering
Should You Change a Trading Strategy While Losing? Coding the Review Process, and 13 Variants That Failed
I wrote 'reassess if losses persist' as preset triggers and a fixed decision order; the first automatic trigger caught two bugs in the review code, and none of 13 risk-reduction variants passed the preset bar.
Letters
Loading comments…