Investing · 2026.09.27 · 5 min · Updated 2026.10.26
Market Timing vs Buy and Hold: Backtests Across Taiwan and US Stocks, Futures, and Crypto, and None Beat Holding
I backtested timing and quant strategies across Taiwan stocks, US stocks, futures, and crypto, and after costs and daily-equity drawdowns none beat holding, while raising monthly contributions actually worked.
Reading
The strategy I liked most going in was timing a 2x Taiwan ETF with a Hull moving average. It climbs fast, so if the average could dodge the big drops, I'd get the gains and take fewer of the hits.
It lost to simply holding. So did everything else: I backtested every timing and quant strategy I could think of across Taiwan stocks, US stocks, futures, and crypto. After trading costs and drawdowns recomputed from daily equity, none of them beat buying and holding the same asset.
The only ones that won added even more leverage, and paid for it with deeper drawdowns or outright liquidation. If you want your money to grow faster, the thing that works best is putting more in each month.
The tools were TradingView's strategy reports, read out through tradingview-mcp, plus Python backtests I wrote myself. The data came from the public feeds of the Taiwan Stock Exchange (TWSE), Yahoo, and Binance.
Fix the comparison rules first
If you don't fix the rules up front, it's easy to keep testing until you get the answer you wanted.
The benchmark is always buying the same asset and holding it, strategies have to pay trading costs, and anything that can't beat the benchmark doesn't get used.
I recompute max drawdown from daily equity instead of using the number in TradingView's report. The report clearly understates drawdown, and if you compare with it, timing strategies look much safer than they are.
That pitfall is covered in TradingView's understated drawdowns and other backtesting traps.
00631L with Hull lost to holding
00631L is a Taiwan ETF that returns 2x the daily move of the Taiwan 50 index. I paired it with Hull Suite on TradingView, which calls bullish or bearish from the Hull moving average (HMA).
Annual returns from 2015 to now, with plain holding on top:
| Strategy | Annual return |
|---|---|
| Holding 00631L | 38.4% |
| Best Hull version (switch to 0050 when bearish) | 32% to 34% |
| Hull, HMA 144 | 24.7% |
| Hull, HMA 169 | 18.7% |
| Classic long-only indicators | 8% to 23% |
The best Hull version, which switched to holding 0050 (the unleveraged Taiwan 50 ETF) when the signal turned bearish, still lost.
It was also very sensitive to parameters. Going from HMA 144 to 169 dropped the annual return from 24.7% to 18.7%, which makes it hard to believe it will keep working.
The only way to beat holding was to add leverage on top when bullish, and 1.5x on 00631L pushed drawdown to around 60%, deeper than just holding.
The classic long-only indicators did worse: RSI, MACD, Bollinger Bands, Keltner Channels, and RSI-2.
Counter-trend strategies sit in cash for most of the year. In a market that keeps going up, the gains they miss never come back.
US stocks, futures, and crypto too
In the US, SPY, QQQ, QLD, and SMH with Hull returned roughly half of what holding did. US stocks bounce back fast after a drop, so moving-average strategies often sell near the bottom and only buy back after a good part of the rebound.
Across 23 AI stocks with Hull 144, the median was 17% a year with a 39% drawdown. Picking out the stocks with the prettiest backtests already carries hindsight, too.
Gold and crude oil futures with Hull had net profit divided by drawdown of only 1.8 and 1.0, not worth it either.
Crypto is where you have to watch survivorship bias the most. I pulled 705 USDT trading pairs from Binance, and 212 of them have been delisted. Those have to be counted too. The three approaches:
| Approach | Result |
|---|---|
| BTC buy and hold | 44% a year, 77% drawdown |
| Weekly rotation into the top 10 to 30 by volume | from +6% to -18% a year |
| Coins newly listed on Binance | median -65% after one year |
Short-term strategies on BTC and ETH perpetual futures mostly lost money at 1x, and at 3x or more nearly all of them got liquidated.
There was a report online claiming 146% a year on 15-minute candles of TAIEX futures (Taiwan's index futures). I rewrote it with the same logic, and it lost money in a blind test as well.
After giving up on timing
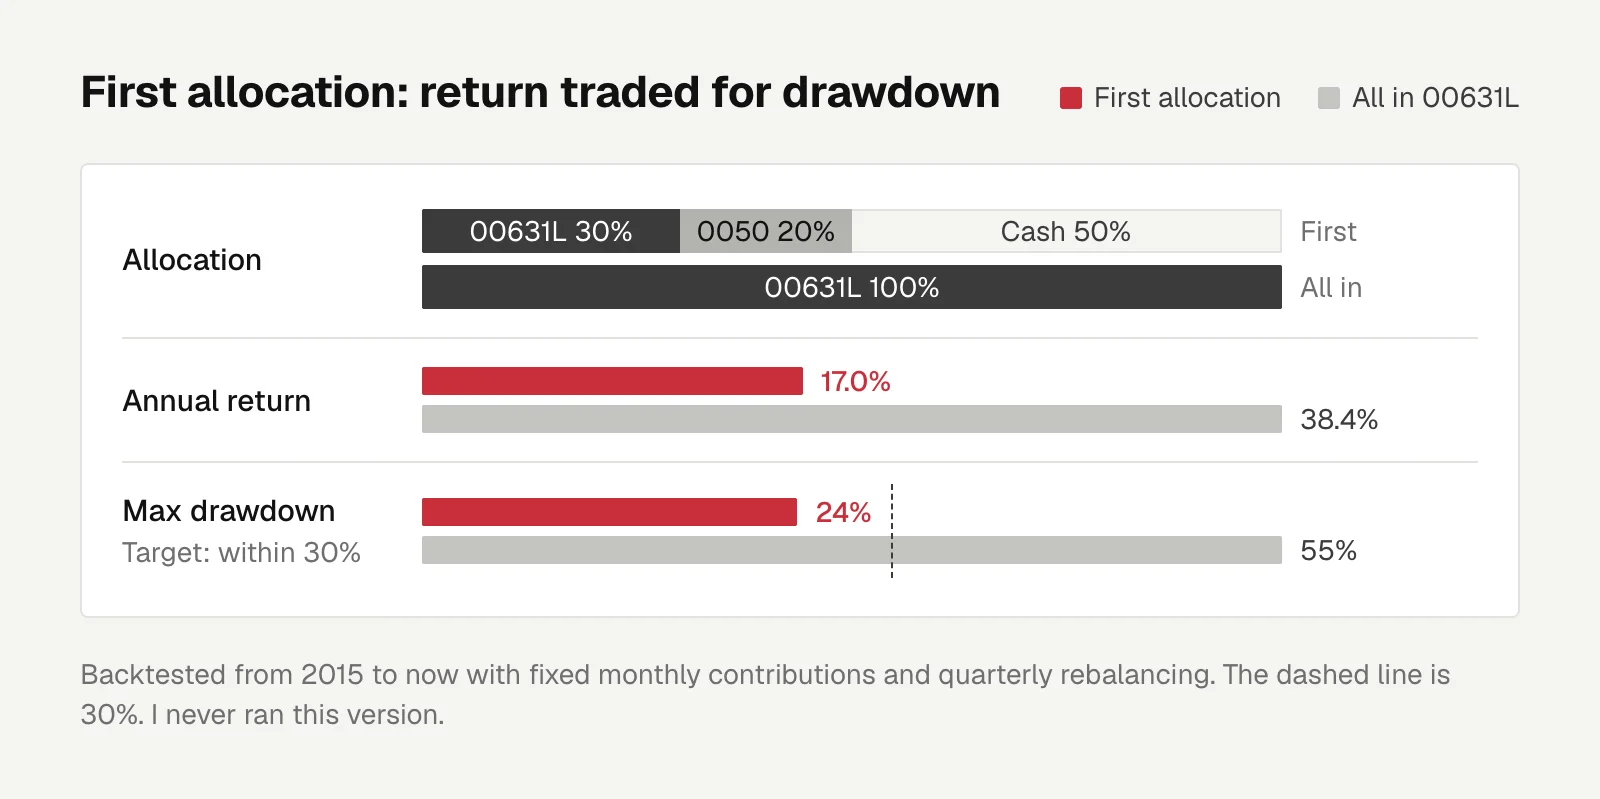
My first allocation was 30% 00631L, 20% 0050, and 50% cash, with a fixed monthly contribution and quarterly rebalancing, aimed at keeping max drawdown within 30%.
Backtested from 2015 to now, it returned 17.0% a year with a 24% max drawdown, versus 38.4% and 55% for going all in on 00631L.
I never ran that version. After rethinking my own situation, I switched to dollar-cost averaging into QQQ every month on IBKR.
Waiting for a big drop didn't help either. Saving each month's money and putting it all in after a 15% to 30% drop came out within plus or minus 2% of just buying every month, which is about the same as noise.
While I was still considering Hull timing, I wrote a small program that computed 00631L's HMA 144 after each trading day's close. It only sent a Telegram message when the signal flipped bullish or bearish. The signals matched TradingView's trade list, and I shut it down the same day I deployed it.
Once I'd decided not to time the market, buy and sell signals had no use, and keeping them around was actually dangerous.
If a sell alert popped up during a big drop, there's a good chance I'd follow it and sell, which is exactly what dollar-cost averaging is meant to prevent.
This is my own backtesting and my own decision, not investment advice.
Investing
Profitable in Simulation, Losing Live: An Honest Dry Run and Testing an AI Trading Model's Hit Rate
I made an always-profitable dry run pay gas and take rejections; a 24-hour test then found no directional edge in the AI model, so I shut the project down under a preset rule.
Letters
Loading comments…